Compute your weighted calisthenics goals for 2023!
Formulas from the statistical analysis of the King of Calisthenics competition
Happy New Year!
In this post, we use New Year as a pretext to write down formulas that computes expected competitive performances based on a calisthenics practitioner bodyweight. Hopefully, those expected lifts can be used to set goals for this year and the next to come!
Caveat: While we intend to help calisthenics practitioners train in an efficient and effective way by making available some useful numbers, data analysis comes with a good share of caution.
First, the context: data from which the analysis is built upon come from a weighted calisthenics competition. Second, for all computed average values, the reader must always keep in mind that some standard deviation
Shall we not be deluded by sheer and raw numbers, we can certainly make good use of them!
In the previous post, the data showed that I am roughly halfway from being average ¯\_(ツ)_/¯.
My weighted calisthenics goal is to become an average balanced participant. I present my target lifts at the end of the post, after revealing the formulas.
Weighted calisthenics
In 2022 was held the season 1 of the King of Weighted Calisthenics competition, an international and internet based event organized by Micha Schulz.
Each participant had to get their weighted equipment and record their 1RM
One-repetition maximum: https://en.wikipedia.org/wiki/One-repetition_maximum attempts for dips, pull-ups and squats according to some specified rules (especially regarding the range of motion).
In weighted calisthenics, one has to lift the additional weight that is attached to one’s body.
Were you a competitive lifter, how much can you expect to lift?
Set a goal for 2023!
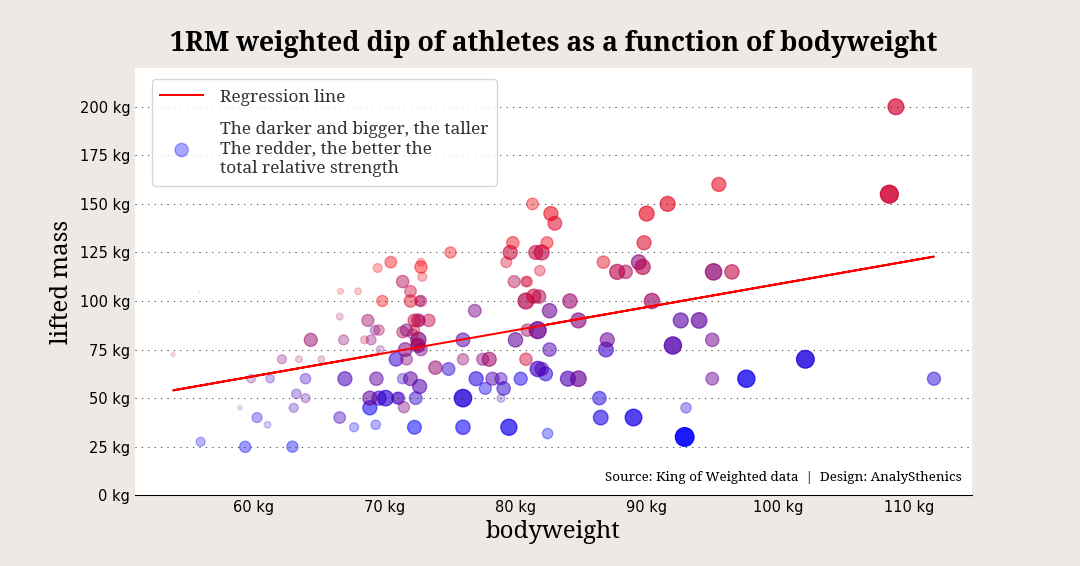
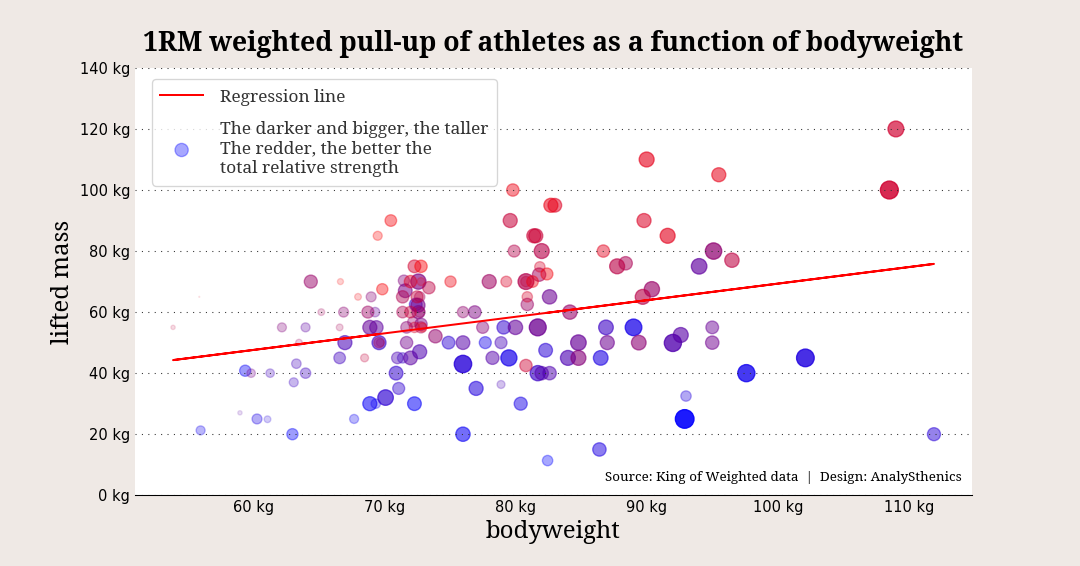
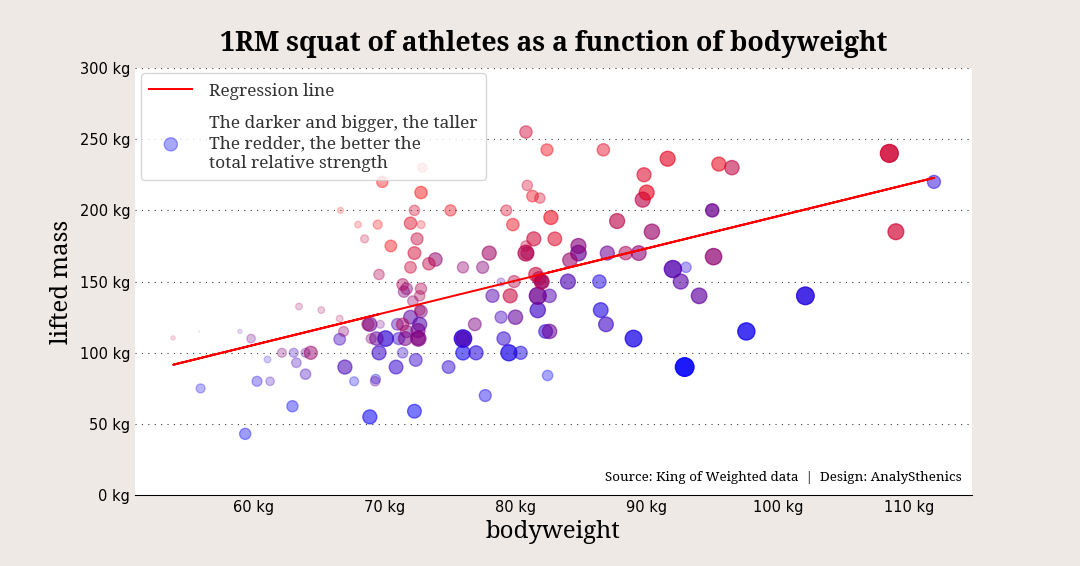
From the data, we compute several formulas, all of the form,
\[goal = a \times bodyweight + b ,\]where your goal will be computed using your bodyweight thanks to two coefficients, a and b. Formulas will be computed for all the three lifts: dip, pull-up, and squat. For each lift, we propose two formulas, one corresponding to the predicted performance of an average participant (still a good goal for most people) and one corresponding to the predicted performance of an average above average participant.
To determine what it means to be above average, we computed the total weight lifted by each participant (dip + pull-up + squat) and then divided it by the weight of participant:
\[\text{score} = \frac{\text{dip} + \text{squat} + \text{pull-up}}{\text{bodyweight}}.\]This score is related to the relative strength of the participants and allows us to compare participants across weight classes. We then ranked the participants using this score. The above average participants are the top 50% of the chart according to this score.
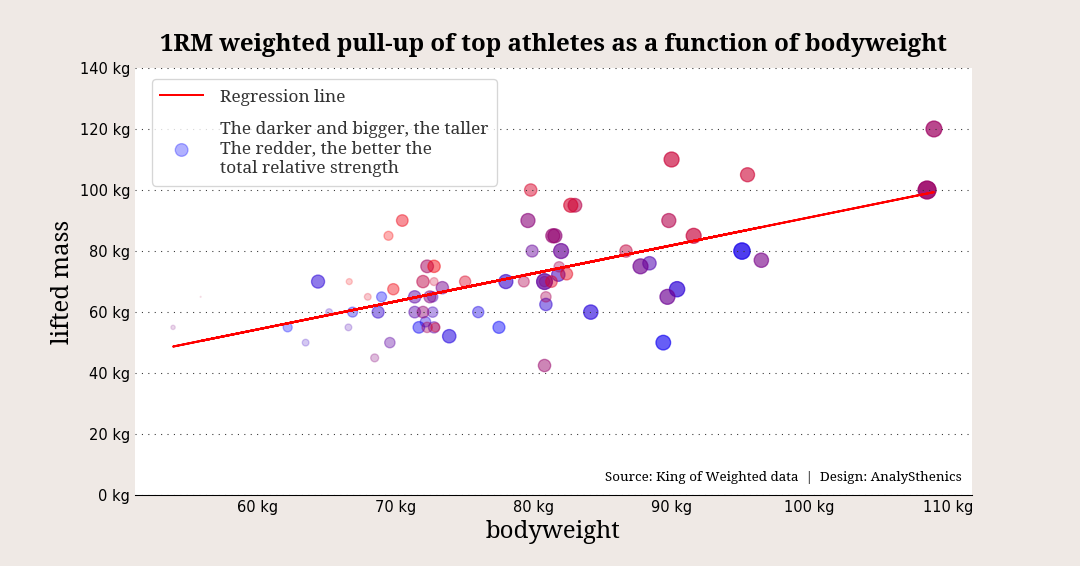
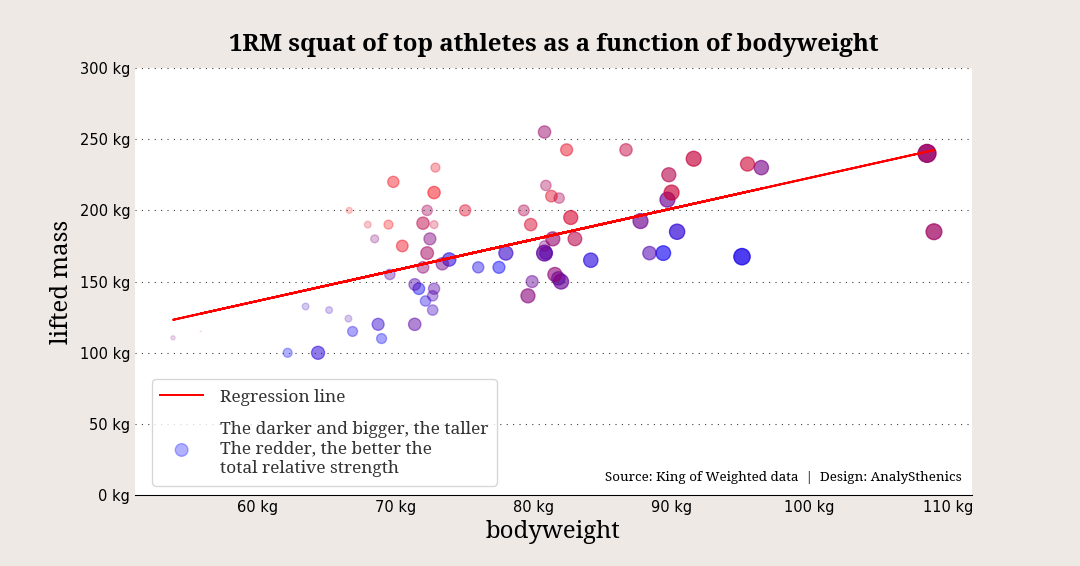
In the following graphs, the color of the points is related to this score: the bluer, the smaller the score, the redder, the higher the score. The size and transparency of the points are related to the height of the athletes: the bigger and darker, the taller.
Average participant
Dip
Pull-up
Squat
Average top-participant
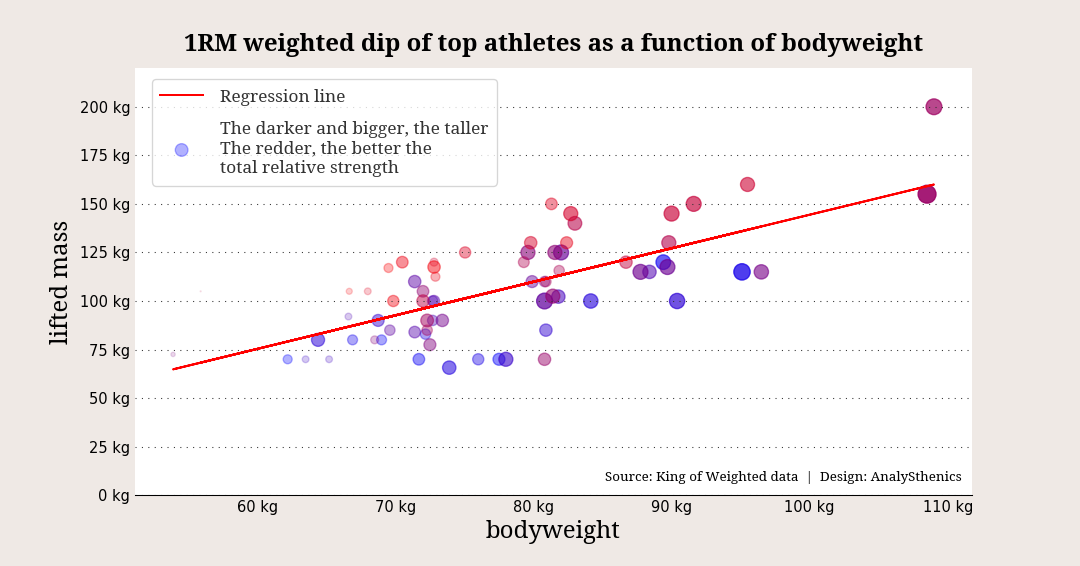
In the following plots, the color of a point corresponds to the rank within the top-scorers and is not corresponding to the previously computed color. As you should have seen, top-scorers are mostly above the average in all the lifts. Of course, some of them compensate a “weak” lift with an outstanding other one.
Dip
Pull-up
Squat
What about me?
Thanks to this competition and this analysis, I have clear goals that I can aim at during the next few months, maybe years.
Side note: Regression lines are useful to compute predictions and extrapolate from the data. However, it is sometimes more interesting to use a subset of the data to compute more personalized quantities. The drawback is that since less data are used, the uncertainty of computed quantities is theoretically larger. In practice, it can give more precise predictions because we are generalizing from points that are more similar.
I started my calisthenics journey in November 2021, it is therefore expected that my weight is still changing and that I will probably gain some muscle mass in the next months. I therefore somehow makes more sense to first compute a target weight from my height and then compute the associated target lifts. Easy enough with all the data!
I am 1.8 m. From the collected data, the subset of athletes with this height have the following average numbers (OG: Overcoming Gravity):
| bodyweight | dip | pull-up | squat | |
|---|---|---|---|---|
| Absolute weights (kg) | 78 | 89 | 66 | 144 |
| Relative weights (%) | 100 | 114 | 85 | 185 |
| OG level | level 10 | level 9 | level 10 |
Those are quite challenging goals for me to have - but what’s the point of a goal if it is not challenging for a bit!
However, those goals are definitely not one year goals.
Nonetheless, let’s see how close I can get!
Let’s meet on this blog in a year to check my results!
With that, we will close this post. Thank you very much for reading up to this point! If you have any remark or question, feel free to reach me, my door is always open!